Area & Rates of Change Graphs | Approximate Areas | Trapezoidal Rule Practice | Exact Areas | Area (Sums) | Area (Differences)
ℹ️ Area and a Rate of Change Graph
The area under a rate of change graph shows the total amount that has changed over time, like how far you’ve traveled if the graph shows speed. The area under a rate of flow graph shows the total amount of water that has flowed over time, like how much water has filled a tank.
Example
A pump fills a water-tank at varying rates over 10-minute periods for 1 hour as shown in the diagram.
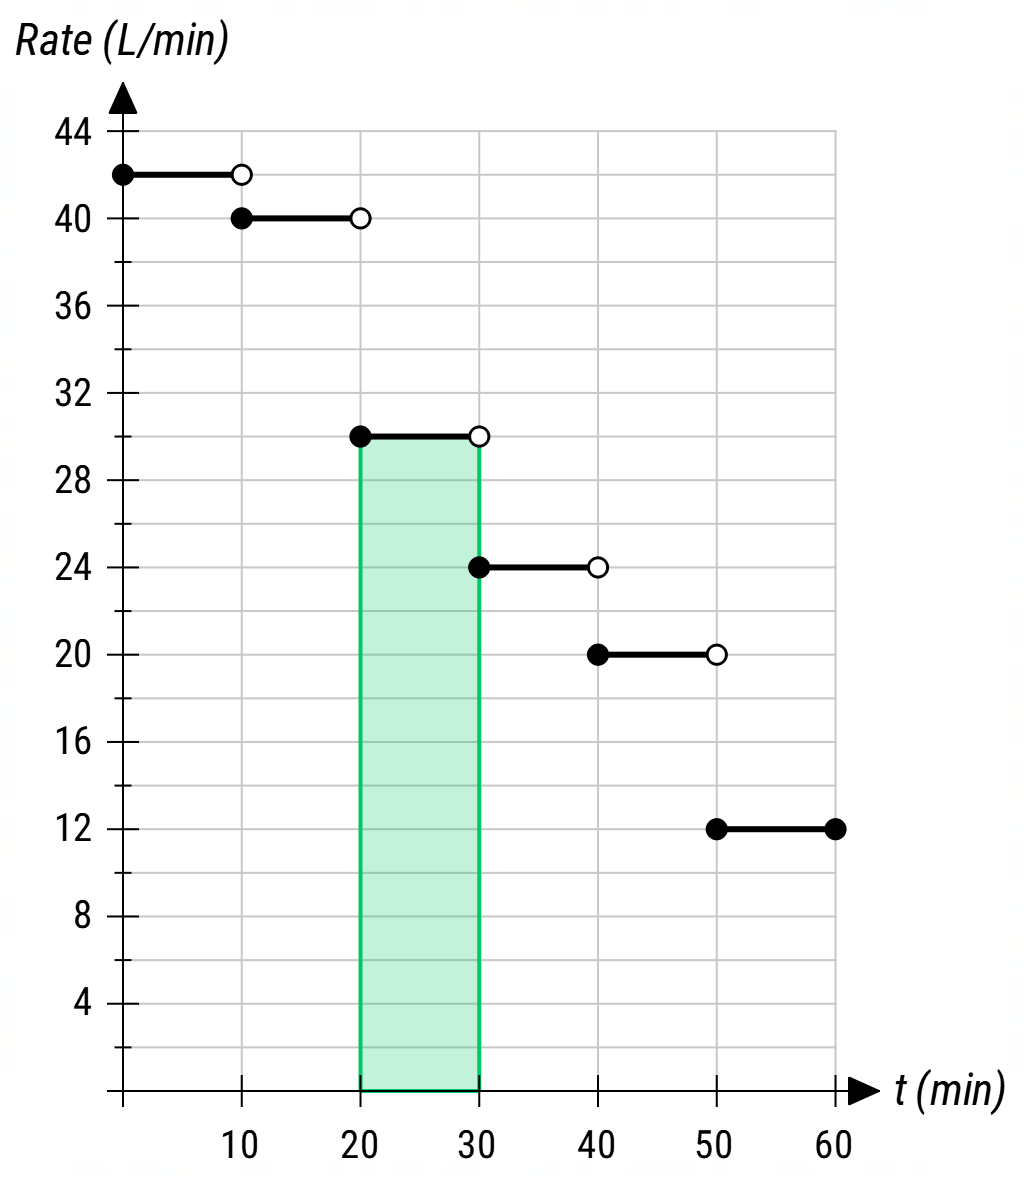
❓ What does the shaded area represent?
✅ The shaded area = \( \style{font-size:10px} {300 \frac{\text{L}}{\min} \times 10 \min = 300 \text{L} \times 10 = 3000 \text{L}} \).
✅ The area represents the total volume of water that was pumped during the 10 minute period.
Practice
❓ What does the shaded area represent in this diagram?
ℹ️ Approximate Area With Trapeziums
To approximate the area under a curve, we start with something we know how to do like - finding the area of simple shapes like a trapezium. The more trapeziums used, the more accurate the estimate of the area gets.
The Desmos app demonstrates how this can be done. Use the app to:
- change the equation of the bounding function
- change the values on the x-axis
- vary the number of trapeziums whose area is being used to estimate the area below the function.
The HSC Reference Sheet give the formula for the area of a trapezium as:
\( A = \frac{h}{2} (a+b) \)
Example: The Trapezoidal Rule
Use four trapeziums to estimate the area bounded by the curve \( y = x^{2} + 1 \), the x-axis and the lines x = 0 and x = 4. The four trapezia and a corresponding table of values are shown below.
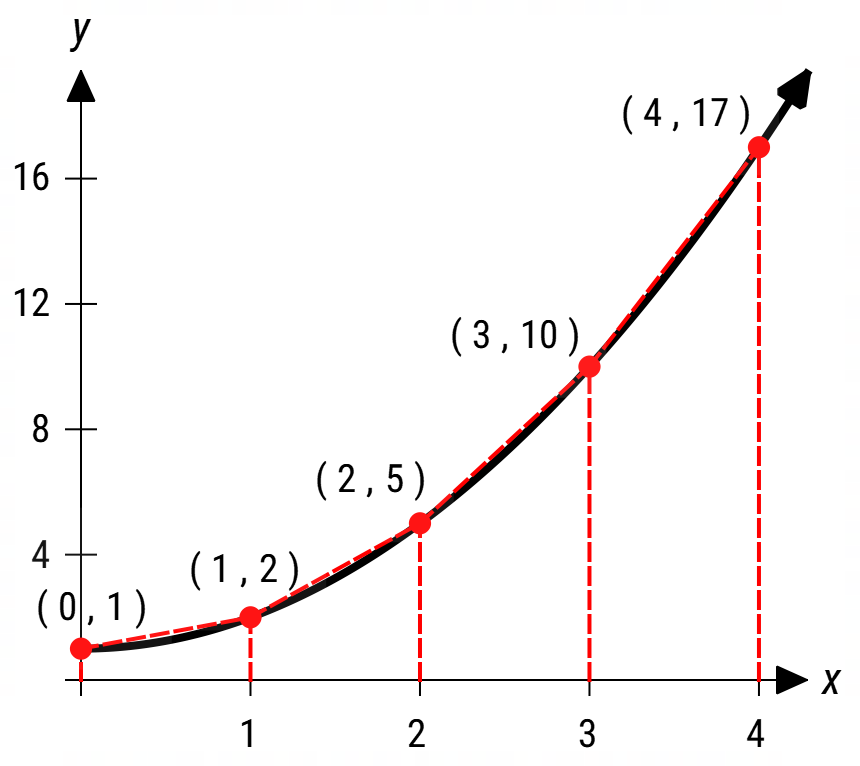
| x | 0 | 1 | 2 | 3 | 4 |
| y | 1 | 2 | 5 | 10 | 17 |
The area formula can be applied four times to find the total area of the four trapeziums where:
- the height, h, of each trapezium is the horizontal spacing of the x-coordinates
- the lengths of the sides of each trapezium are the function values (y-values) at those x-coordinates
\( \text{Area} = \frac{1}{2}(1 + 2) + \frac{1}{2}(1 + 5) + \frac{1}{2}(5 + 10) + \frac{1}{2}(10 + 17) = 26 \)
The area calculation can be manipulated:
\begin{align} \text{Area} &= \frac{1}{2}(1 + 2) + \frac{1}{2}(1 + 5) + \frac{1}{2}(5 + 10) + \frac{1}{2}(10 + 17) \\ &= \frac{1}{2} ((1 + 2) + (1 + 5) + (5 + 10) + (10 + 17)) \\ &= \frac{1}{2} ((1 + 17) + 2(5 + 10 + 17)) \end{align}
The first and last function values are used once in the calculation while the remaining function values are used twice.
The expression has the same form as the more complicated looking version of the Trapezoidal Rule provided on the HSC Reference Sheet:
\( \int_{a}^{b} f(x) \,dx = \frac{b-a}{2n} \left\{f(a)+f(b) + 2 \left[f(x_{1}) + ... + f(x_{n-1}) \right] \right\} \)
🔄 Trapezoidal Rule Practice
Practice
ℹ️ Exact Area and the Definite Integral
The area under a curve between two points on a graph represents the total accumulation of a quantity, like distance traveled or water collected, and the definite integral is a mathematical tool used to calculate this area precisely.